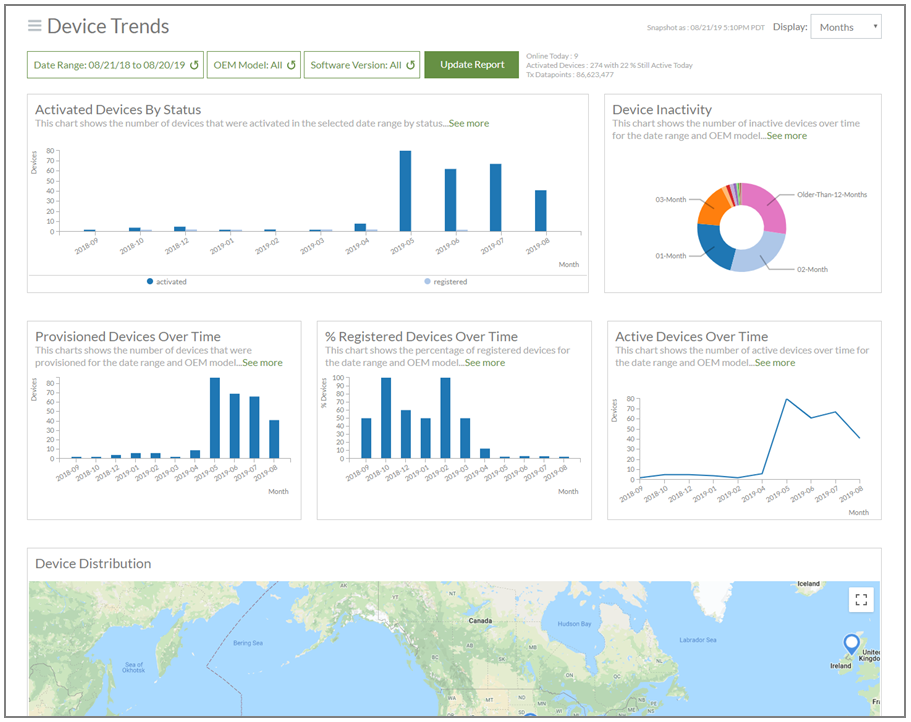
Ayla Insights: Device Trends
The Device Trends reports (shown below) enable you to monitor device trends over a specific time frame for the following:
- Connected status of devices
- The number of provisioned devices
- Percentage of registered devices
- Activity/inactivity of devices over time
- Offline events
- Distribution (and location) of online and offline devices
The Device Trends set provides the following seven individual reports: (Click each for a description.)
This individual report (example below) shows the number of activated versus registered devices for the time frame selected (weeks, months, or years). You can use this information, for example, to understand if the fact that devices are registered impacts how often they are connected.
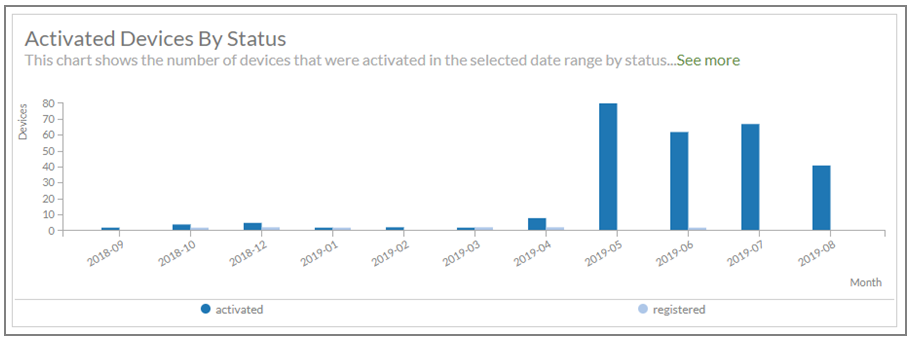
The statuses are as follows:
- Activated devices are onboarded (by enabling an initial Ayla service connection) and sending data to the cloud. A device remains activated for the duration specified in the terms of the license.
- Registered devices are devices that the end user registers using the mobile application.
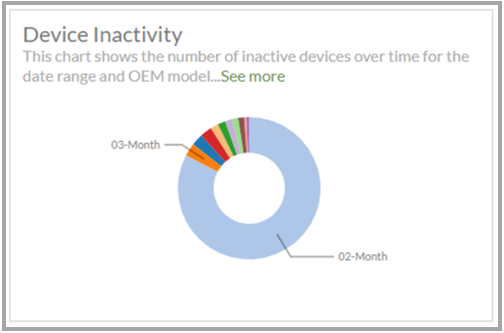
This individual report (example below) shows the number of devices inactive over the time period selected in the filters. The device is considered “inactive” if it has not connected to the cloud within 30 days. You can use this report, for example, to determine if devices are regularly left inactive, if there is an even distribution of inactivity, or if there was a particular time span where devices became inactive.
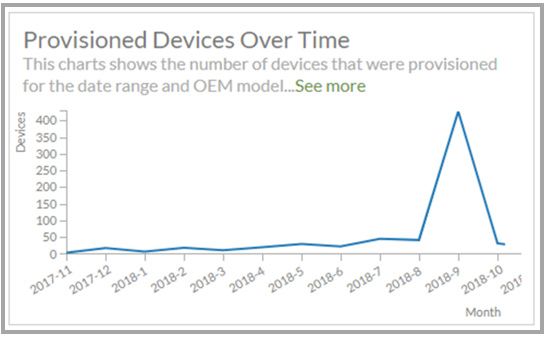
This individual report (example below) shows the number of devices provisioned during the time range specified in the filters. A provisioned device has a DSN (Device Serial Number) and is authorized to connect to the cloud.
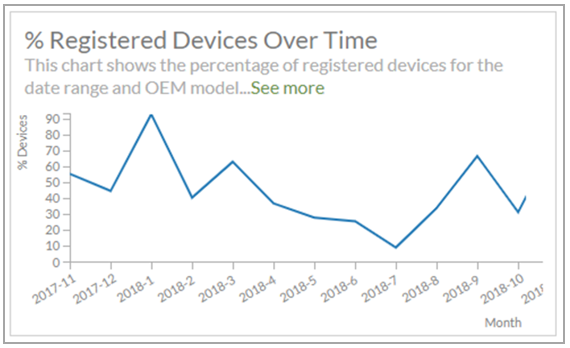
This individual report (example below) shows the percentage of activated devices that are registered based on the date range, OEM model, and other filters applied to the Device Trend reports. A device is considered registered if the end user registered the device using the mobile application. The device is then associated with that end user’s Ayla account. One person can have multiple user accounts, and one device may have multiple users registered to it.
|
NOTE |
If there was already a record of the end user’s UUID (universally unique identifier) for a previous device registration, that device is not counted in this report. |
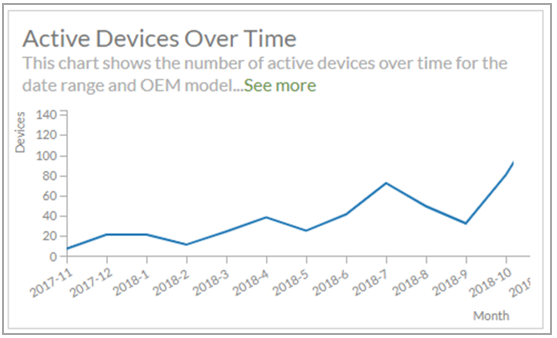
This individual report (example below) shows the number of active devices for the time period and the OEM model selected in the filters. A device is considered “active” if it has connected to the Ayla cloud at least once in the past 30 days from the current date. This information is a good metric to determine if devices are being used during specific time ranges.
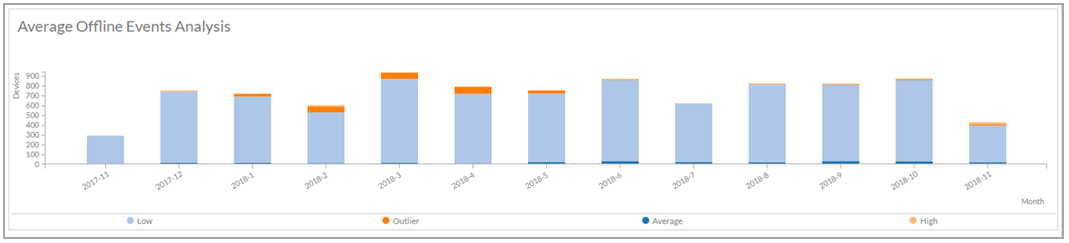
This individual report (example below) shows the approximate number and time frame of offline devices. You may want to monitor this data since the number of offline events should be minimal; as ultimately, you want devices (especially static devices, like a thermostat) connected as long as possible to transmit events whenever they happen.
This individual report (example below) shows a map of the last known geographical locations of connected devices based on the date range and OEM model specified in the filters for the Device Trends report set. The location is determined by the IP address of the device’s connection.
|
NOTE |
Per privacy regulations, the locations are an approximate locality (e.g. may be based on the zip code in the US and other countries that have postal codes). |
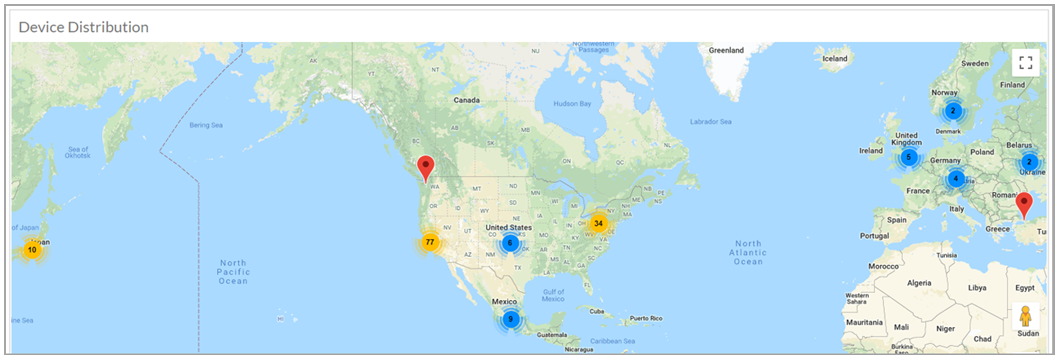
Color codes are as follows:
- Red - indicates that there is one device in that area (i.e. zip code).
- Blue - indicates that there are 2–9 devices in that area (i.e. zip code).
- Yellow - indicates that there are 10-99 devices in that area (i.e. zip code).
- Red - indicates that there are 100-999 devices in that area (i.e. zip code).
- Purple - indicates that there are 1000-9999 devices in that area (i.e. zip code).
How to get here on the dashboard: Click Ayla Insights in the Navigation Panel, sign in to Ayla Insights, then click Overview in the Navigation Panel for Insights.
See also: Ayla Insights, Insights Onboarding Analysis Reports, Insights Device Software Analysis Reports, Insights Device Transmission Analysis Reports, Insights Device Details Reports, Insights User Analysis Reports, Insights Notification Analysis Reports, Insights Datapoint Transmissions Trends Reports, Insights Datapoint Analysis Reports.
Please click here to let us know how we're doing. Thank you.